Pygletによる「手抜き」OpenGL入門
12. 大きいサイズのデータの可視化
12. 1 複雑ネットワーク
グラフ構造
研究分野や対象に依らず、グラフ(あるいはネットワーク)が問題の抽象化や分析において重要な役割を果たす事例は枚挙にいとまがない。 対象をグラフで表現した上でそのグラフの性質を調べたり、あるいは、ある構造のグラフ上に制限された場合のダイナミクスを分析したり、と、アプローチも様々である。
ここで、グラフとは、複数の頂点(ノード)と、それらを結ぶエッジ(リンク)で構成されるような図形で、エッジに方向が定義されていたり(有向グラフ)、 エッジに別の属性が付与されていたりと、様々なバリエーションが考えられる。 簡単のため、以下ではシンプルな無向グラフに限定して話しを進めることにしよう。
どんなグラフであっても、扱う対象の規模が大きくなれば、そのサイズ(頂点の数もエッジの数も)膨大となり、全体をプロットして様子を眺められるように するだけでも難儀である。 例えば、頂点(ノード)の数が数千以上もあるようなグラフを単純に「点と線」で描画したとしても、画面は隙間なく塗りつぶされてしまって、そこから何か特徴を読み解くのは困難であろう。
そのため、複雑ネットワーク(complex network)研究の普及も手伝って、大規模なグラフの処理や可視化の研究が進み、その成果を反映したツール類も充実してきている。 ここでは、データの読み込みやグラフの加工についてはライブラリを使いつつも、 可視化の部分についてはPygletとOpenGL(GPU)の力を借りて、ある程度大きなサイズのグラフでも「サクサク」表示できるプログラムを作成し てみよう。
データの準備
グラフのサンプルとして、ここではRoldan Pozo氏のウェブページ中にあるデータセットの一覧
の中から、
Erdos Collaborations
(協同研究者が多いことで知られる著名な数学者 Paul Erdős の共著関係のグラフ)
や
Yeast
(イースト菌の遺伝子相互作用のネットワーク)を用いることにしよう。
これらのデータをダウンロード(またはダウンロードして解凍)すると、拡張子 .net のファイルが含まれている。
これはPajek形式と呼ばれるデータのフォーマットで、頂点の番号(と名前)とエッジのリストがテキストとして書き込まれている。
以下では、Erdos02.netとYeastL.netのデータファイルが、Pythonコードと同じディレクトリに保存されていることを想定して、話しを進める。
これらのデータをPythonに読み込んだり、グラフの処理を行うために、Pythonモジュールnetworkxを使用するので、Python環境にあらかじめ組み込んでおく:
pip install networkx
その後は、このモジュールの機能を使って、様々な形式のデータファイルを読み込んでオブジェクト化し、操作ができるようになる。
import networkx as nx

G = nx.read_pajek("Erdos02.net")
バネ埋め込み法
エッジで繋がっている頂点同士はできるだけ近くに、その一方で、頂点が密集しすぎないような配列を探すアルゴリズムとして、 force-directed graph drawing がよく用いられる。 ある初期条件(例えばランダム配置)から始め、 頂点同士に距離に応じた仮想的な力が作用すると仮定して、力学的に頂点を動かしていくうちに、好ましい配置(に近い配置)に落ち着くことを期待するものである。
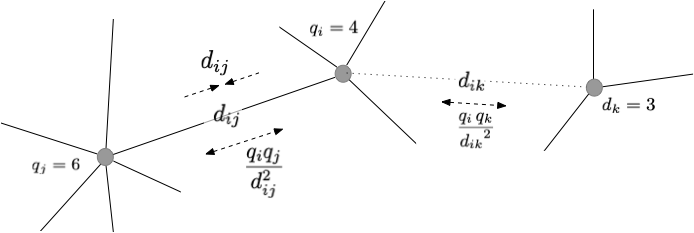
ここでは、力の代わりに「ポテンシャルエネルギー」を使って考えてみよう。 エッジで繋がっている頂点同士が、仮想的なバネ(自然長は0)で繋がれているとすると、系全体のエネルギーは $$ \Phi_1 =\frac{1}{2} \sum_i \sum_{j \in E(i) } \left| \boldsymbol{r}_j - \boldsymbol{r}_i \right|^2 $$ と書くことができる。ここで、$E(i)$は頂点$i$のエッジを表し、$\Phi_1$ 連結した頂点同士が近づくほど、エネルギーが低くなる効果を与える。 それとは反対に、頂点同士が互いに反発する効果を、斥力ポテンシャル $$ \Phi_2 = \sum_i \sum_{j \neq i} \frac{q_i \, q_j}{ \left| \boldsymbol{r}_j - \boldsymbol{r}_i \right|^m } $$ で与えることにする。ここで$q_i$は頂点$i$のグラフの次数で、次数の大きな頂点(ハブ)同士はできるだけ離れやすくなるような効果を生む。 $m$は斥力の到達範囲を調整するパラメータで、例えば、静電気力(電荷の反発)を手本にすれば$m=1$となる。 引力ポテンシャルと斥力ポテンシャルの和を系をエネルギー $$ \Phi = \Phi_1 + \Phi_2 $$ とおいて、エネルギーが小さくなるように配置を調整する。 具体的にはポテンシャルエネルギーの勾配に沿って頂点の座標を動かせばよい。 $$ \frac{d \boldsymbol{r}_i}{d t} = - \frac{\partial \Phi}{\partial \boldsymbol{r}_i} $$ このようにすることで、ここで定義したポテンシャルエネルギーには下限が存在するので、(数値的な安定性は別とすれば) 最終状態に漸近することが保証される。
エッジで繋がっている頂点同士は距離に比例した引力が、頂点同士は静電気力に似た反発力が作用する。
SSBOを介したシェーダーとのデータの受け渡し
グラフの規模が大きくなると、力の計算と頂点位置の更新の計算量も増えるので、コンピュートシェーダーを使った並列計算が有効となる。
そのためには、グラフの情報をコンピュートシェーダー側に渡し、結果をPythonプログラムから参照する必要がある。 そのような用途に用いられるのが、SSBO(Shader Storage Buffer Object)という機構である。
Uniform変数を用いたデータの受け渡しでは、GPU側からの変数への書き込みは不可能で、データの流れは一方向である。 また、テクスチャーを用いた方法では、扱えるデータがテクスチャーの色情報に制限される。 なお、SSBOを用いるためには、OpenGLのバージョン4.3以上(4.2の場合はARB_shader_storage_buffer_object 拡張機能)が必要となる。
NumPyの'float32'型の配列がdataにセットされているとすると、
ssbo = GLuint()
glGenBuffers(1,ssbo)
glBindBuffer(GL_SHADER_STORAGE_BUFFER, ssbo)
glBufferData(GL_SHADER_STORAGE_BUFFER, data.nbytes, data.ctypes.data, GL_DYNAMIC_DRAW)
glBindBufferBase(GL_SHADER_STORAGE_BUFFER, 0, ssbo)
という一連の呼び出しでSSBOが生成され、この場合、シェーダー側の0番目(glBindBufferBase()の2番目の引数で指定)のSSBO変数にバインドされる。
GL_DYNAMIC_DRAWは、このバッファーの内容をシェーダー側で変更する場合の指定で、
CPU側のデータを読み出すのみならばGL_READ_ONLYとしておく。
これに対応して、コンピュートシェーダー側で
layout (std430, binding = 0) buffer SSBO {
  float data[];
} ;
のように変数宣言を行うことで、配列 dataにアクセスできるようになる。
計算の終了後、CPU側からSSBOのデータを読み出すには
glBindBuffer(GL_SHADER_STORAGE_BUFFER, ssbo)
mapped_data_ptr = glMapBuffer(GL_SHADER_STORAGE_BUFFER, GL_READ_ONLY)
mapped_data = ctypes.cast(mapped_data_ptr, ctypes.POINTER(ctypes.c_float))
result = np.array(mapped_data)
glUnmapBuffer(GL_SHADER_STORAGE_BUFFER)
のように、目的とするSSBOをバインドした後、配列データへのポインターを得て、そこからデータを読み出す必要がある。
このようにして一次元配列データをCPUとGPUとで受け渡すことはできるが、多次元配列や構造体をそのまま扱うことはできなため、 グラフの連結性を共有するために、若干の工夫が必要となる。そのため、
- 頂点の座標は、'float32'型のデータを3つずつ組にして、1次元配列に埋め込む。$i$番目の頂点の座標は
i*3,i*3+1,i*3+2番目の要素に対応。 - 頂点毎の次数(そこから延びているエッジの本数)を表す 'int32'の1次元配列
nedges。$i$番目の次数は、配列のi番目に対応。 - 頂点の連結先のリスト(次の項目)の何番目からデータを読み出すかを表す'int32'の配列
indices。 - 接続先のリストを格納する'int32'型の配列
neighbors。$i$番目の頂点の連結先の頂点の番号はneighbors[indices[i]]から始まり、neighbors[indices[i]+nedges[i]-1]までとなる。
これら4つの配列に対してそれぞれSSBOをバインドし、シェーダーで頂点毎に力を計算し、頂点の座標を更新することにする。
グラフの表現
グラフのエッジは単純な線で、頂点は小さな立方体で表現することにする。
立方体の頂点は専用のジオメトリーシェーダーで生成し、Python側はその中心とサイズ、頂点の番号と共にGL_POINTSを描画するとする。
頂点の番号は整数型で渡すのが自然であるが、PygletのVertexListは浮動小数データを渡すことを前提にしているので、 浮動小数値のリストを渡し、シェーダー側でint型に変換するようにしている。
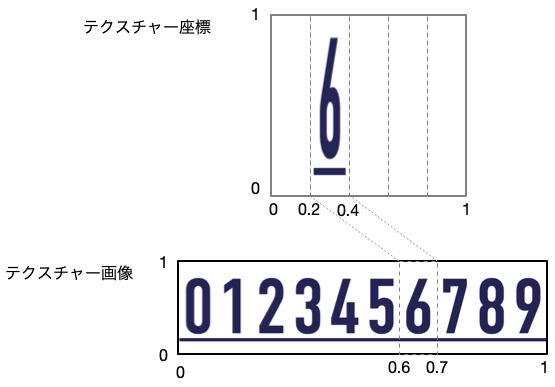
あらかじめ、0から9までの数字を含む画像を用意し、2次元テクスチャーとしてシェーダーに渡しておき、 フラグメントシェーダーで頂点の番号に従って、テクチャー座標を算出することで、立方体の表面にその頂点の番号(5桁)を表示する。 これによって、特徴ある構造を発見した際に、それがどの頂点に関係したものであるかを視覚的に確認することが可能となる。
以上をコーディングしてみた例が prog-12-1.py である。
import networkx as nx
import pyglet
from pyglet.gl import *
import numpy as np
from pyglet.math import Mat4, Vec3, Vec4
import ctypes

compute_src = """#version 430 core
precision highp float;

layout (local_size_x = 1, local_size_y = 1, local_size_z = 1) in;

layout (std430, binding = 0) buffer SSBO0 {
  float positions[];
} ;

layout (std430, binding = 1) buffer SSBO1 {
  int nedges[];
} ;

layout (std430, binding = 2) buffer SSBO2 {
  int indices[];
} ;

layout (std430, binding = 3) buffer SSBO3 {
  int neighbors[];
} ;


vec3 get_position(uint i) {
    return vec3(positions[i*3], positions[i*3+1], positions[i*3+2]) ;
}

void set_position(uint i, vec3 value) {
    positions[i*3] = value.x ;
    positions[i*3+1] = value.y ;
    positions[i*3+2] = value.z ;
}

vec3 attractive_force(vec3 pi, vec3 pj) {
    return (pj - pi) ;
}

vec3 repulsive_force(vec3 pi, vec3 pj) {
    vec3 direction = normalize(pi - pj) ;
    float dist = distance(pi,pj) ;
    float force = 1.0/(dist*dist) ;
    return force * direction ;
}

void main() {
    uint i = gl_GlobalInvocationID.x ;
    uint nedge = gl_NumWorkGroups.x;
    int j,ncnt ;
    vec3 posi = get_position(i) ;
    vec3 force = vec3(0,0,0) ;

    // attraction
    j = indices[i] ;
    ncnt = nedges[i] ;
    while (ncnt>0) {
        vec3 posj = get_position(neighbors[j]) ;
        force = force + attractive_force(posi, posj) ;
        j = j + 1 ;
        ncnt -= 1 ;
    }

    // repulsion
    for (j=0 ; j<nedge ; j++) {
        if (j==i) continue ;
        vec3 posj = get_position(j) ;
        float charge2 = float(nedges[i]) * float(nedges[j]) ;
        force = force + charge2 * repulsive_force(posi, posj) ;
    }

#define DT 0.002

    posi = posi + force*DT ;

    set_position(i, posi) ;
}
"""
vertex_source1 = '''#version 330 core
  in vec3 position;

  uniform WindowBlock {
        mat4 projection;
        mat4 view;
  } window;

  uniform mat4 model ;

  void main(void)
  {
     mat4 modelview = window.view * model;
     vec4 pos = modelview * vec4(position, 1.0);
     gl_Position = window.projection * pos;
  }
'''

fragment_source1 = '''#version 330 core
  out vec4 final_colors ;
  void main(void)
  {
     final_colors = vec4(0.2, 0.7, 0.5, 0.75) ;
  }
'''

vertex_source2 = '''#version 330 core
in vec3 position;
in float size;
in float phi;
in float theta;
in float nodeid; // could not use int...

out vec3 vertex_position;
out float vertex_size;
out float vertex_phi;
out float vertex_theta;
out int vertex_nodeid;

void main(void) {
    vertex_position = position ;
    vertex_size = size ;
    vertex_phi = phi ;
    vertex_theta = theta ;
    vertex_nodeid = int(nodeid) ;
}
'''
geometry_source2 = '''#version 330 core
layout(points) in;
layout(triangle_strip, max_vertices = 48) out;

in vec3 vertex_position[];
in float vertex_size[];
in float vertex_phi[];
in float vertex_theta[];
in int vertex_nodeid[];

out vec3 geom_position;
out vec3 geom_normal;
out vec2 geom_texcoord;
flat out int geom_nodeid;

uniform WindowBlock {
    mat4 projection;
    mat4 view;
} window;

uniform mat4 model;

void main(void) {
    const vec3 vlist[8] = vec3[8](
        vec3(-0.5, -0.5, -0.5),
        vec3( 0.5, -0.5, -0.5),
        vec3( 0.5,  0.5, -0.5),
        vec3(-0.5,  0.5, -0.5),
        vec3(-0.5, -0.5,  0.5),
        vec3( 0.5, -0.5,  0.5),
        vec3( 0.5,  0.5,  0.5),
        vec3(-0.5,  0.5,  0.5)
    );

    const int indices[36] = int[36](
        0, 2, 1, 0, 3, 2,
        4, 5, 6, 4, 6, 7,
        0, 1, 5, 0, 5, 4,
        2, 3, 7, 2, 7, 6,
        0, 4, 7, 0, 7, 3,
        1, 2, 6, 1, 6, 5
    );

     const vec2 texcoords[36] = vec2[36](
        vec2(1.0, 0.0), vec2(0.0, 1.0), vec2(0.0, 0.0),
        vec2(1.0, 0.0), vec2(1.0, 1.0), vec2(0.0, 1.0),

        vec2(0.0, 0.0), vec2(1.0, 0.0), vec2(1.0, 1.0),
        vec2(0.0, 0.0), vec2(1.0, 1.0), vec2(0.0, 1.0),

        vec2(1.0, 0.0), vec2(1.0, 1.0), vec2(0.0, 1.0),
        vec2(1.0, 0.0), vec2(0.0, 1.0), vec2(0.0, 0.0),

        vec2(0.0, 0.0), vec2(1.0, 0.0), vec2(1.0, 1.0),
        vec2(0.0, 0.0), vec2(1.0, 1.0), vec2(0.0, 1.0),

        vec2(0.0, 0.0), vec2(1.0, 0.0), vec2(1.0, 1.0),
        vec2(0.0, 0.0), vec2(1.0, 1.0), vec2(0.0, 1.0),

        vec2(1.0, 0.0), vec2(1.0, 1.0), vec2(0.0, 1.0),
        vec2(1.0, 0.0), vec2(0.0, 1.0), vec2(0.0, 0.0)
    );

    mat3 rot_z = mat3(
        cos(vertex_phi[0]), -sin(vertex_phi[0]), 0.0,
        sin(vertex_phi[0]),  cos(vertex_phi[0]), 0.0,
        0.0, 0.0, 1.0
    );

    mat3 rot_x = mat3(
        1.0, 0.0, 0.0,
        0.0, cos(vertex_theta[0]), -sin(vertex_theta[0]),
        0.0, sin(vertex_theta[0]), cos(vertex_theta[0])
    );

    mat4 modelview = window.view * model;
    mat3 normal_matrix = transpose(inverse(mat3(modelview)));

    for (int i = 0; i < 36; i += 3) {
        vec3 p1 = rot_z * rot_x * vlist[indices[i]];
        vec3 p2 = rot_z * rot_x * vlist[indices[i+1]];
        vec3 p3 = rot_z * rot_x * vlist[indices[i+2]];
        vec3 normal = normalize(cross(p2 - p1, p3 - p1));

        vec4 pos;

        pos = modelview * vec4(p1 * vertex_size[0] + vertex_position[0], 1.0);
        gl_Position = window.projection * pos;
        geom_position = pos.xyz;
        geom_normal = normal_matrix * normal;
        geom_texcoord = texcoords[i];
        geom_nodeid = vertex_nodeid[0];
        EmitVertex();

        pos = modelview * vec4(p2 * vertex_size[0] + vertex_position[0], 1.0);
        gl_Position = window.projection * pos;
        geom_position = pos.xyz;
        geom_normal = normal_matrix * normal;
        geom_texcoord = texcoords[i + 1];
        geom_nodeid = vertex_nodeid[0];
        EmitVertex();

        pos = modelview * vec4(p3 * vertex_size[0] + vertex_position[0], 1.0);
        gl_Position = window.projection * pos;
        geom_position = pos.xyz;
        geom_normal = normal_matrix * normal;
        geom_texcoord = texcoords[i + 2];
        geom_nodeid = vertex_nodeid[0];
        EmitVertex();

        EndPrimitive();
    }
}
'''

fragment_source2 = """#version 330 core
in vec3 geom_position;
in vec3 geom_normal;
in vec2 geom_texcoord;
flat in int geom_nodeid;

out vec4 frag_color;

uniform vec3 light_position ;

uniform sampler2D texture_2d;

vec4 get_tex_color(int id) {
    int d4 = (id / 10000) % 10;
    int d3 = (id / 1000) % 10;
    int d2 = (id / 100) % 10;
    int d1 = (id / 10) % 10;
    int d0 = id % 10;

    vec4 frag_color ;

    if (geom_texcoord.x < 2.0/10.0) {
        vec2 texcoord_d4 = vec2( float(d4)/10.0  + (geom_texcoord.x-0.0)/2, geom_texcoord.y) ;
        frag_color = texture(texture_2d, texcoord_d4);
    } else if (geom_texcoord.x < 4.0/10.0) {
        vec2 texcoord_d3 = vec2( float(d3)/10.0  + (geom_texcoord.x-0.2)/2, geom_texcoord.y) ;
        frag_color = texture(texture_2d, texcoord_d3);
    } else if (geom_texcoord.x < 6.0/10.0) {
        vec2 texcoord_d2 = vec2( float(d2)/10.0  + (geom_texcoord.x-0.4)/2, geom_texcoord.y) ;
        frag_color = texture(texture_2d, texcoord_d2);
    } else if (geom_texcoord.x < 8.0/10.0) {
        vec2 texcoord_d1 = vec2( float(d1)/10.0  + (geom_texcoord.x-0.6)/2, geom_texcoord.y) ;
        frag_color = texture(texture_2d, texcoord_d1);
    } else {
        vec2 texcoord_d0 = vec2( float(d0)/10.0  + (geom_texcoord.x-0.8)/2, geom_texcoord.y) ;
        frag_color = texture(texture_2d, texcoord_d0);
    }
    return frag_color ;
}


void main()
{
    int nodeid = gl_PrimitiveID % 1000 + 1;
    vec4 color = vec4(1.0, 0.5, 0.5, 1.0) ;
    vec3 normal = normalize(geom_normal);
    vec3 light_dir = normalize(light_position - geom_position);
    float diff = max(dot(normal, light_dir), 0.0);
    vec4 tex_color = get_tex_color(geom_nodeid) ;
    frag_color = tex_color * color * diff ;
    // frag_color = (texture(texture_2d, geom_texcoord) * color)  ;
}
"""

filename = "YeastL.net"
# filename = "Erdos02.net"
G = nx.read_pajek(filename).to_undirected()

# selec connected graphics, them choose the maximum one
largest_cc = max(nx.connected_components(G), key=len)

# generate a subgraph from the largest connected graph
G2 = G.subgraph(largest_cc).copy()

print(G2)
for i,label in enumerate(G2.nodes()):
    print(i,label)

# prepare arrays to bind SSBOs
node_mapping = {node: i for i, node in enumerate(G2.nodes, start=0)}
nnode = len(node_mapping)
print('number of nodes=',nnode)

positions = np.random.normal(loc=0.0, scale=30.0, size=(nnode,3)).astype(dtype='float32')
nedges = np.zeros(shape=(nnode,), dtype='int32')
indices = np.zeros(shape=(nnode,), dtype='int32')
neighbors = [ ]

icum=0
i=0
for node, adjacencies in G2.adjacency():
    node_num = node_mapping[node]
    neighbor = [node_mapping[neighbor] for neighbor in adjacencies]
    neighbors.extend(neighbor)
    nedges[i] = len(neighbor)
    indices[i] = icum
    # print(i,nedges[i],icum)
    icum += nedges[i]
    i += 1

neighbors = np.array(neighbors,dtype='int32')

#
#
window = pyglet.window.Window(width=1280, height=720, resizable=True)
window.set_caption('Complex Network')
glClearColor(0.05, 0.05, 0.15, 1)
glEnable(GL_DEPTH_TEST)
glBlendFunc(GL_SRC_ALPHA, GL_ONE_MINUS_SRC_ALPHA)
numbers = pyglet.image.load('number-texture.png')
texture = numbers.get_texture()
glActiveTexture(GL_TEXTURE0)
glBindTexture(texture.target, texture.id)

# compute shader program
program = pyglet.graphics.shader.ComputeShaderProgram(compute_src)
# shader to display edges with lines
vert_shader1 = pyglet.graphics.shader.Shader(vertex_source1, 'vertex')
frag_shader1 = pyglet.graphics.shader.Shader(fragment_source1, 'fragment')
shader1 = pyglet.graphics.shader.ShaderProgram(vert_shader1, frag_shader1)
# shader to display nodes with tetrahedron
vert_shader2 = pyglet.graphics.shader.Shader(vertex_source2, 'vertex')
geom_shader2 = pyglet.graphics.shader.Shader(geometry_source2, 'geometry')
frag_shader2 = pyglet.graphics.shader.Shader(fragment_source2, 'fragment')
shader2 = pyglet.graphics.shader.ShaderProgram(vert_shader2, geom_shader2, frag_shader2)


# edges
batch1 = pyglet.graphics.Batch()
# nodes
batch2 = pyglet.graphics.Batch()

# generate SSBOs (shader storate buffers)
position_data = positions.flatten()
ssbo0 = GLuint()
glGenBuffers(1,ssbo0)

nedge_data = nedges.flatten()
ssbo1 = GLuint()
glGenBuffers(1,ssbo1)

index_data = indices.flatten()
ssbo2 = GLuint()
glGenBuffers(1,ssbo2)

neighbor_data = neighbors.flatten()
ssbo3 = GLuint()
glGenBuffers(1,ssbo3)

def update_position():
  global positions, position_data
  program.use()

  glBindBuffer(GL_SHADER_STORAGE_BUFFER, ssbo0)
  glBufferData(GL_SHADER_STORAGE_BUFFER, position_data.nbytes, position_data.ctypes.data, GL_DYNAMIC_DRAW)
  glBindBufferBase(GL_SHADER_STORAGE_BUFFER, 0, ssbo0)

  glBindBuffer(GL_SHADER_STORAGE_BUFFER, ssbo1)
  glBufferData(GL_SHADER_STORAGE_BUFFER, nedge_data.nbytes, nedge_data.ctypes.data, GL_STATIC_DRAW)
  glBindBufferBase(GL_SHADER_STORAGE_BUFFER, 1, ssbo1)

  glBindBuffer(GL_SHADER_STORAGE_BUFFER, ssbo2)
  glBufferData(GL_SHADER_STORAGE_BUFFER, index_data.nbytes, index_data.ctypes.data, GL_STATIC_DRAW)
  glBindBufferBase(GL_SHADER_STORAGE_BUFFER, 2, ssbo2)

  glBindBuffer(GL_SHADER_STORAGE_BUFFER, ssbo3)
  glBufferData(GL_SHADER_STORAGE_BUFFER, neighbor_data.nbytes, neighbor_data.ctypes.data, GL_STATIC_DRAW)
  glBindBufferBase(GL_SHADER_STORAGE_BUFFER, 3, ssbo3)

  with program:
      program.dispatch(nnode, 1, 1)

  glBindBuffer(GL_SHADER_STORAGE_BUFFER, ssbo0)
  mapped_data_ptr = glMapBuffer(GL_SHADER_STORAGE_BUFFER, GL_READ_ONLY)
  mapped_data = ctypes.cast(mapped_data_ptr, ctypes.POINTER(ctypes.c_float))
  result = np.ctypeslib.as_array(mapped_data, shape=(nnode,3))
  position_data[:] = result.flatten()[:]
  glUnmapBuffer(GL_SHADER_STORAGE_BUFFER)
  program.stop()
  return result

def gen_vertices(nedges, indices, neighbors, pos):
  vertices = [ ]
  N = len(nedges)
  for i in range(N):
    x0 = pos[i,0]
    y0 = pos[i,1]
    z0 = pos[i,2]
    k = indices[i]
    l = k + nedges[i]
    for n in range(k,l):
      j = neighbors[n]
      x1 = pos[j,0]
      y1 = pos[j,1]
      z1 = pos[j,2]
      vertices.extend([x0,y0,z0,x1,y1,z1])
  return vertices

def gen_points(pos):
  points = [ ]
  N = len(nedges)
  for i in range(N):
    x0 = pos[i,0]
    y0 = pos[i,1]
    z0 = pos[i,2]
    points.extend([x0,y0,z0])
  return points

time =0
def update(dt):
  global time
  res = update_position()
  vertices = gen_vertices(nedge_data, index_data, neighbor_data, res)
  vertex_list1.position[:] = vertices

  points = gen_points(res)
  vertex_list2.position[:] = points

  time += dt

fov = 60
@window.event
def on_mouse_scroll(x, y, scroll_x, scroll_y):
    global fov
    fov *= np.exp(scroll_y*0.05)
    if fov < 1:
        fov = 1
    elif fov>120:
        fov = 120
    window.projection = Mat4.perspective_projection(window.aspect_ratio, z_near=0.1, z_far=500, fov=fov)
    return pyglet.event.EVENT_HANDLED

model_mat = Mat4()
@window.event
def on_mouse_drag(x, y, dx, dy, buttons, modifiers):
  global model_mat
  model_mat = Mat4.from_rotation(dx*fov*0.0005, Vec3(0, 1, 0))  @ model_mat
  model_mat = Mat4.from_rotation(-dy*fov*0.0005, Vec3(1, 0, 0)) @ model_mat
  shader1['model'] = model_mat
  shader2['model'] = model_mat
  return pyglet.event.EVENT_HANDLED

running=False
@window.event
def on_key_press(symbol, modifiers):
    global model_mat,positions,position_data,running
    if symbol == pyglet.window.key.R:
        model_mat = Mat4()
        shader1['model'] = model_mat
        shader2['model'] = model_mat
    elif symbol == pyglet.window.key.I:
        positions = np.random.normal(loc=0.0, scale=30.0, size=(nnode,3)).astype(dtype='float32')
        position_data = positions.flatten()
    elif symbol == pyglet.window.key.S:
        if running:
            pyglet.clock.unschedule(update)
            running = False
        else:
            pyglet.clock.schedule_interval(update,1/30)
            running = True
    return pyglet.event.EVENT_HANDLED

@window.event
def on_resize(width, height):
    window.viewport = (0, 0, width, height)
    window.projection = Mat4.perspective_projection(window.aspect_ratio, z_near=0.1, z_far=500, fov=fov)
    return pyglet.event.EVENT_HANDLED

@window.event
def on_draw():
    window.clear()
    ratio = window.height/window.width
    window.viewport = (0, 0, window.width, window.height)
    window.projection = Mat4.perspective_projection(window.aspect_ratio, z_near=0.1, z_far=500, fov=fov)
    shader1['model']= model_mat
    shader2['model']= model_mat
    glEnable(GL_BLEND)
    batch1.draw()
    glDisable(GL_BLEND)
    batch2.draw()

# initial plot
result = update_position()
vertices = gen_vertices(nedge_data, index_data, neighbor_data, result)
vertex_list1 = shader1.vertex_list(len(vertices)//3, GL_LINES, batch=batch1)
vertex_list1.position[:] = vertices

points = gen_points(result)
vertex_list2 = shader2.vertex_list(len(points)//3, GL_POINTS, batch=batch2)
vertex_list2.position[:] = points
vertex_list2.size[:] = [0.5] * (len(points)//3)
vertex_list2.phi[:] = np.random.uniform(0.0, 2*np.pi, len(points)//3)
vertex_list2.theta[:] = np.random.uniform(0.0, 2*np.pi, len(points)//3)
vertex_list2.nodeid = [i for i in range(len(points)//3)]

shader2['light_position'] = Vec3(0,500,1000)

window.view = Mat4.look_at(position=Vec3(0,0,200), target=Vec3(0,0,0), up=Vec3(0,1,0))

pyglet.clock.schedule_interval(update,1/30)
running=True
pyglet.app.run()
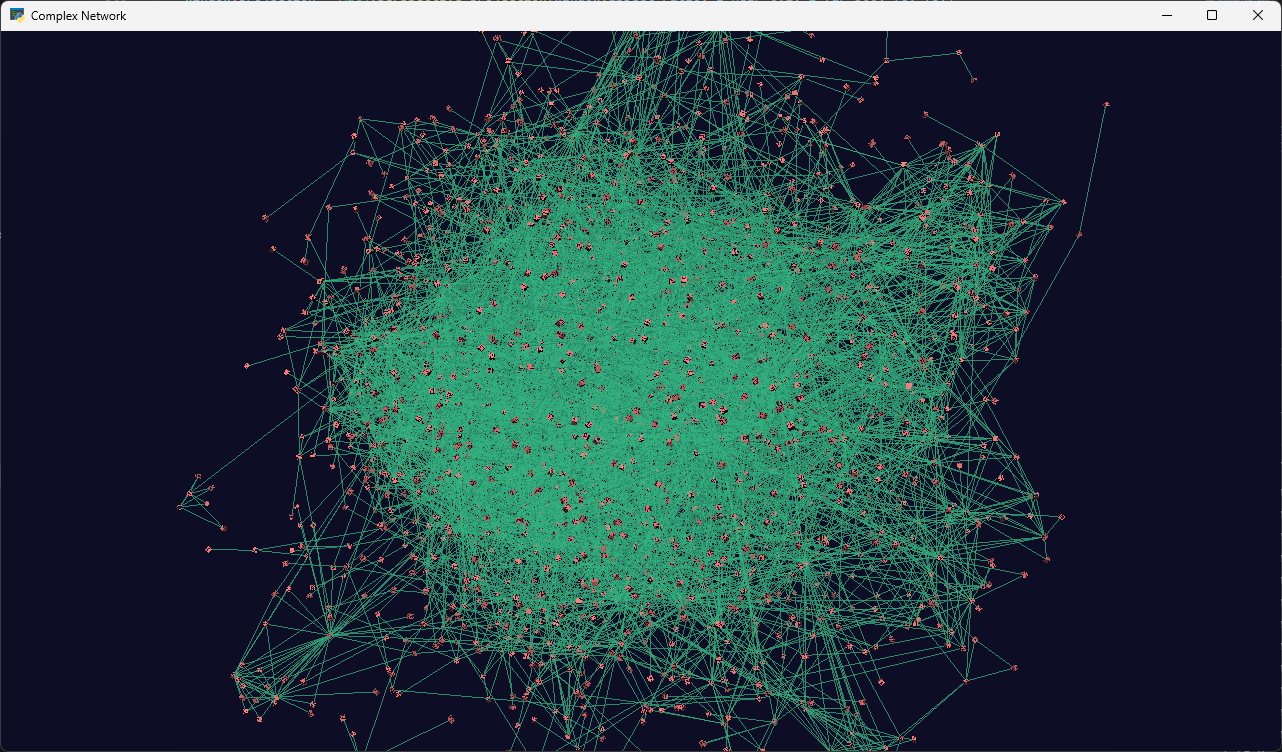
"YeastL.net"を表示中のprog-12-1.pyの実行画面の様子
マウスのドラッグで回転、ホィールでズーミングが可能。 キーボードの I を押すと、配置がリセットされる。
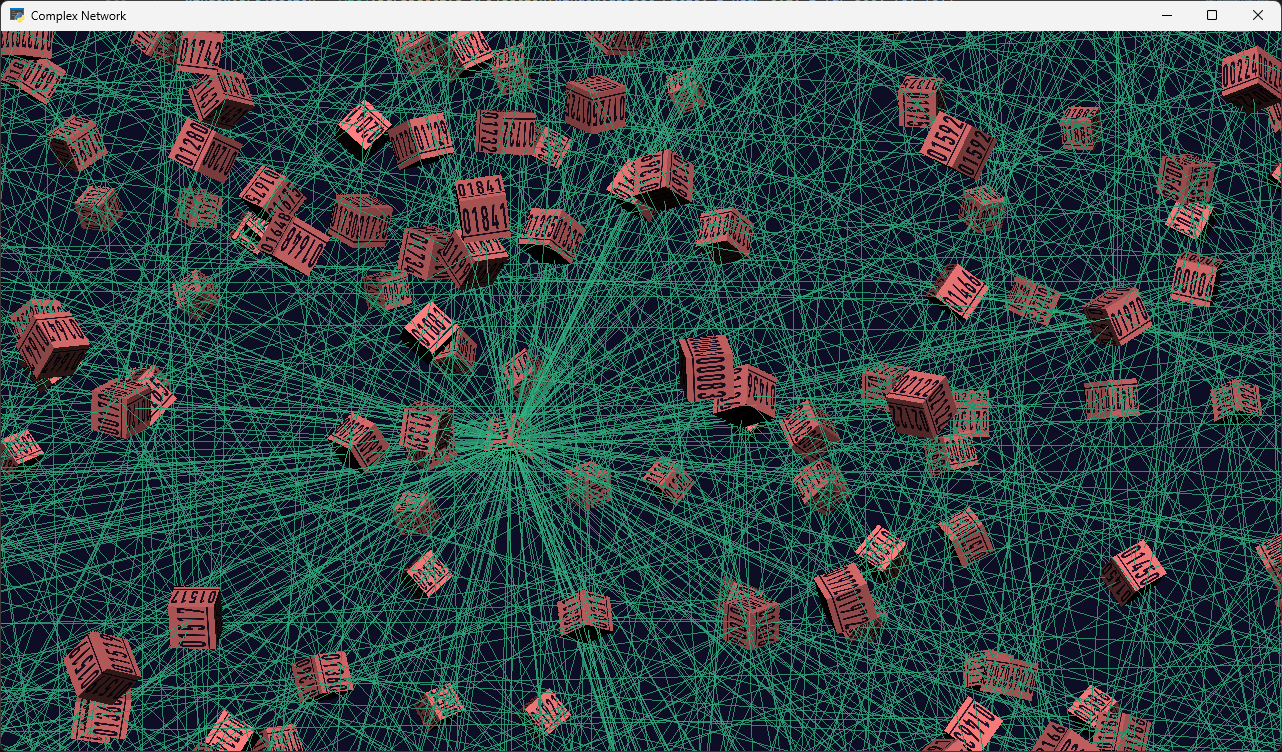
ズームインした際の表示。頂点は立方体で表示し、表面には通し番号がテクスチャーとして貼り付けられている。

12. 2 動物の群れ行動
群れの計測
テレビや映像作品で鳥や魚の大群が登場することはしばしばあるが、日常生活の中でも、例えば、夕方に街路樹に集まってくるムクドリの群れを目にした ことがある方もきっと多いはずだ。ねぐらとなっている樹木や近くの電線の下には大量の糞が落ちているし、盛んに鳴きあって煩いこともあって、 都市部の迷惑者扱いされている。
以下の動画は、ホシムクドリが比較的低空で群れ飛行している様子を撮影したものだ。 ムクドリの群れとしては大きいほうではないが、それでも700近くの個体が確認できる。 特にリーダーが指示しているわけでも無さそうだが、群れ全体がまるでひとつの生命体のように振る舞うように見えて、 どのようにその構造や秩序が制御されているのか(あるいは、偶然的な事象を我々が穿った見方をしているだけなのか)、興味が持たれる。
ここでは、この群れの様子を2台のカメラで同時にステレオ撮影して、三角測量の原理で 1/60秒毎の位置を推定したデータ
starling-20141026s2f8.h5 を用意した。
データファイルは HDF5 形式で、属性 frameが撮影フレーム番号の配列で、
属性 x, y, z が各フレームの座標(単位m)の配列となっている。
求めた座標は計測誤差を含み、映像が重なり合って計測が不能な個体が生じることから、データ自体は完全では無いものの、 概ね、ムクドリの体長(約20cm)よりは小さな精度で位置が推定できている。 たった6秒ほどのデータであっても15万ほどのサンプル数となるので、その様子を可視化したり把握するには、コンピュータの力を借りることになる。
動きの表現
多数の個体が飛行する中で、それぞれの個体がどのように運動しているかを分かりやすく表示するためのひとつの方法として、 個体の位置を点で表示しつつ、着目するフレームから過去に遡るに従って、点の色を薄くする(透過度を上げる)ようにしてみよう。 ちょうど彗星が尾を引くように見せるわけである。
そこで、頂点リストとして、座標とフレーム番号を全てシェーダーに渡しておいてから、Uniform変数で着目しているフレーム番号を渡し(変数名frame、
シェーダー側で点のアルファを決めるようにする。
具体的には、フラグメントシェーダーで
float alpha ;
if (vertex_frames > frame) alpha = 0.05 ;
else alpha = 0.98 * exp(-float(frame - vertex_frames)*0.05 ) + 0.02 ;
final_colors = vec4(vertex_colors.rgb, alpha) ;
のように透明度を与えるようにした。
(書きかけ)
import numpy as np
import math
import pyglet
from pyglet.gl import *
from pyglet.math import Mat4, Vec3
from pyglet.graphics.shader import Shader, ShaderProgram
import h5py

vertex_source0 = """#version 330 core
    in vec3 position;
    in vec4 colors;
    in float frames;

    out vec3 vertex_position;
    out vec4 vertex_colors;
    flat out int vertex_frames;

    uniform WindowBlock
    {
        mat4 projection;
        mat4 view;
    } window;

    uniform mat4 model;

    void main()
    {
        mat4 modelview = window.view * model;
        vec4 pos = modelview * vec4(position, 1.0);
        gl_Position = window.projection * pos;
        gl_PointSize = 3.0 ;
        vertex_position = pos.xyz;
        vertex_colors = colors;
        vertex_frames = int(frames);
    }
"""

fragment_source0 = """#version 330 core
    in vec3 vertex_position;
    in vec4 vertex_colors;
    flat in int vertex_frames;

    out vec4 final_colors;

    uniform int frame;

    void main()
    {
       vec2 pos = gl_PointCoord * 2.0 - 1.0;
       float r = 1.0 - dot(pos, pos);
       if (r < 0.0) discard;
       float alpha ;
       if (vertex_frames > frame) alpha = 0.05 ;
       else alpha = 0.98 * exp(-float(frame - vertex_frames)*0.05 ) + 0.02 ;
       final_colors = vec4(vertex_colors.rgb, alpha) ;
    }
"""

vertex_source1 = """#version 330 core
    in vec3 position;
    in vec4 colors;

    out vec4 vertex_colors;
    out vec3 vertex_position;

    uniform WindowBlock
    {
        mat4 projection;
        mat4 view;
    } window;

    uniform mat4 model;

    void main()
    {
        mat4 modelview = window.view * model;
        vec4 pos = modelview * vec4(position, 1.0);
        gl_Position = window.projection * pos;
        vertex_position = pos.xyz;
        vertex_colors = colors;
    }
"""

fragment_source1 = """#version 330 core
    in vec4 vertex_colors;
    in vec3 vertex_position;
    out vec4 final_colors;

    void main()
    {
        final_colors = vertex_colors ;
    }
"""

window = pyglet.window.Window(width=1280, height=720, resizable=True)
window.set_caption('Flock of Starling')

# シェーダーのコンパイル
batch0 = pyglet.graphics.Batch()
vert_shader0 = Shader(vertex_source0, 'vertex')
frag_shader0 = Shader(fragment_source0, 'fragment')
shader0 = ShaderProgram(vert_shader0, frag_shader0)

batch1 = pyglet.graphics.Batch()
vert_shader1 = Shader(vertex_source1, 'vertex')
frag_shader1 = Shader(fragment_source1, 'fragment')
shader1 = ShaderProgram(vert_shader1, frag_shader1)

# 初期化
glClearColor(0.1, 0.1, 0.2, 1.0)
glEnable(GL_VERTEX_PROGRAM_POINT_SIZE)
glBlendFunc(GL_SRC_ALPHA, GL_ONE_MINUS_SRC_ALPHA)
glEnable(GL_BLEND)

@window.event
def on_draw():
    window.clear()
    shader0['model']=Mat4()
    shader1['model']=Mat4()
    batch0.draw()
    batch1.draw()

fov = 60
@window.event
def on_resize(width, height):
    window.viewport = (0, 0, width, height)
    ratio = width/height
    window.projection = Mat4.perspective_projection(window.aspect_ratio, z_near=0.01, z_far=1000, fov=fov)
    return pyglet.event.EVENT_HANDLED

@window.event
def on_mouse_scroll(x, y, scroll_x, scroll_y):
    global fov
    fov -= scroll_y
    if fov < 1:
        fov = 1
    elif fov>120:
        fov = 120
    window.projection = Mat4.perspective_projection(window.aspect_ratio, z_near=0.01, z_far=1000, fov=fov)
    return pyglet.event.EVENT_HANDLED

@window.event
def on_mouse_drag(x,y,dx,dy,buttons,modifiers):
    global view_matrix
    rotz = (x-window.width/2)/window.width * fov * dy * 0.0001
    roty = -dx*fov*0.0001
    rotx = dy*fov*0.0001 * np.exp(-8*(window.width/2-x)**2 / window.width**2)
    view_matrix = Mat4.from_rotation(rotz, Vec3(0, 0, 1)) @ view_matrix
    view_matrix = Mat4.from_rotation(roty, Vec3(0, 1, 0)) @ view_matrix
    view_matrix = Mat4.from_rotation(rotx, Vec3(1, 0, 0)) @ view_matrix
    window.view = view_matrix
    return pyglet.event.EVENT_HANDLED

@window.event
def on_key_press(symbol, modifiers):
    global view_matrix
    if symbol == pyglet.window.key.R or symbol == pyglet.window.key.HOME:
        view_matrix = Mat4.look_at(position=Vec3(0,50,-50), target=Vec3(0,0,-50), up=Vec3(0,0,1))
        window.view = view_matrix
    elif symbol == pyglet.window.key.UP:
        view_matrix = Mat4.from_translation(Vec3(0,0,2)) @ view_matrix
        window.view = view_matrix
    elif symbol == pyglet.window.key.DOWN:
        view_matrix = Mat4.from_translation(Vec3(0,0,-2)) @ view_matrix
        window.view = view_matrix
    elif symbol == pyglet.window.key.RIGHT:
        view_matrix = Mat4.from_translation(Vec3(-2,0,0)) @ view_matrix
        window.view = view_matrix
    elif symbol == pyglet.window.key.LEFT:
        view_matrix = Mat4.from_translation(Vec3(2,0,0)) @ view_matrix
        window.view = view_matrix

    return pyglet.event.EVENT_HANDLED

def gen_grid(x0,x1,y0,y1,z0,z1,step,shader,batch):
    vertices = []
    nx = len(np.arange(x0,x1,step))
    ny = len(np.arange(y0,y1,step))
    nz = len(np.arange(z0,z1,step))

    for x in np.arange(x0,x1,step):
        for y in np.arange(y0,y1,step):
            for z in np.arange(z0,z1,step):
                vertices.extend([x, y, z])

    indices = []
    for i in range(nx):
        for j in range(ny):
            for k in range(nz):
                p0 = i*ny*nz + j*nz + k
                if i<nx-1:
                    p1 = (i+1)*ny*nz + j*nz + k
                    indices.extend([p0, p1])
                if j<ny-1:
                    p2 = i*ny*nz + (j+1)*nz + k
                    indices.extend([p0, p2])
                if k<nz-1:
                    p3 = i*ny*nz + j*nz + (k+1)
                    indices.extend([p0, p3])

    vertex_list = shader.vertex_list_indexed(len(vertices)//3, GL_LINES, indices, batch=batch,
                                             position=('f', vertices),
                                             colors =('f', [0.2,0.2,0.5,1]*(len(vertices)//3)))
    return vertex_list

frame_cur = 0
frame_max = 0
frame_min = 0
def update(dt):
    global frame_cur
    shader0['frame'] = int(frame_cur)
    frame_cur +=1
    if frame_cur > frame_max:
        frame_cur = frame_min

# HDF5データ読み込み

filename = "starling-20141026s2f8.h5"
with h5py.File(filename, 'r') as h5f:
    data = {}
    for key in h5f.keys():
        data[key] = h5f[key][:]

# 頂点リスト生成
vertices = np.column_stack((data['x'], data['z'], -data['y'])).ravel()
nvertex = len(vertices)//3

frames = data['frame']

vertex_list = shader0.vertex_list(len(vertices)//3, GL_POINTS, batch=batch0)
vertex_list.position[:] = vertices
vertex_list.colors[:] =  [1,1,1,1] * nvertex
vertex_list.frames[:] = frames

vertex_grid = gen_grid(-30,40, 0,30, -100,0, 10, shader1, batch1)

frame_max = max(frames)
frame_min = min(frames)
frame_cur = frame_min

view_matrix = Mat4.look_at(position=Vec3(0,50,-50), target=Vec3(0,0,-50), up=Vec3(0,0,1))
window.view = view_matrix

on_resize(*window.size)

shader0['frame'] = int(frame_cur)

pyglet.clock.schedule_interval(update,1/30)
pyglet.app.run()
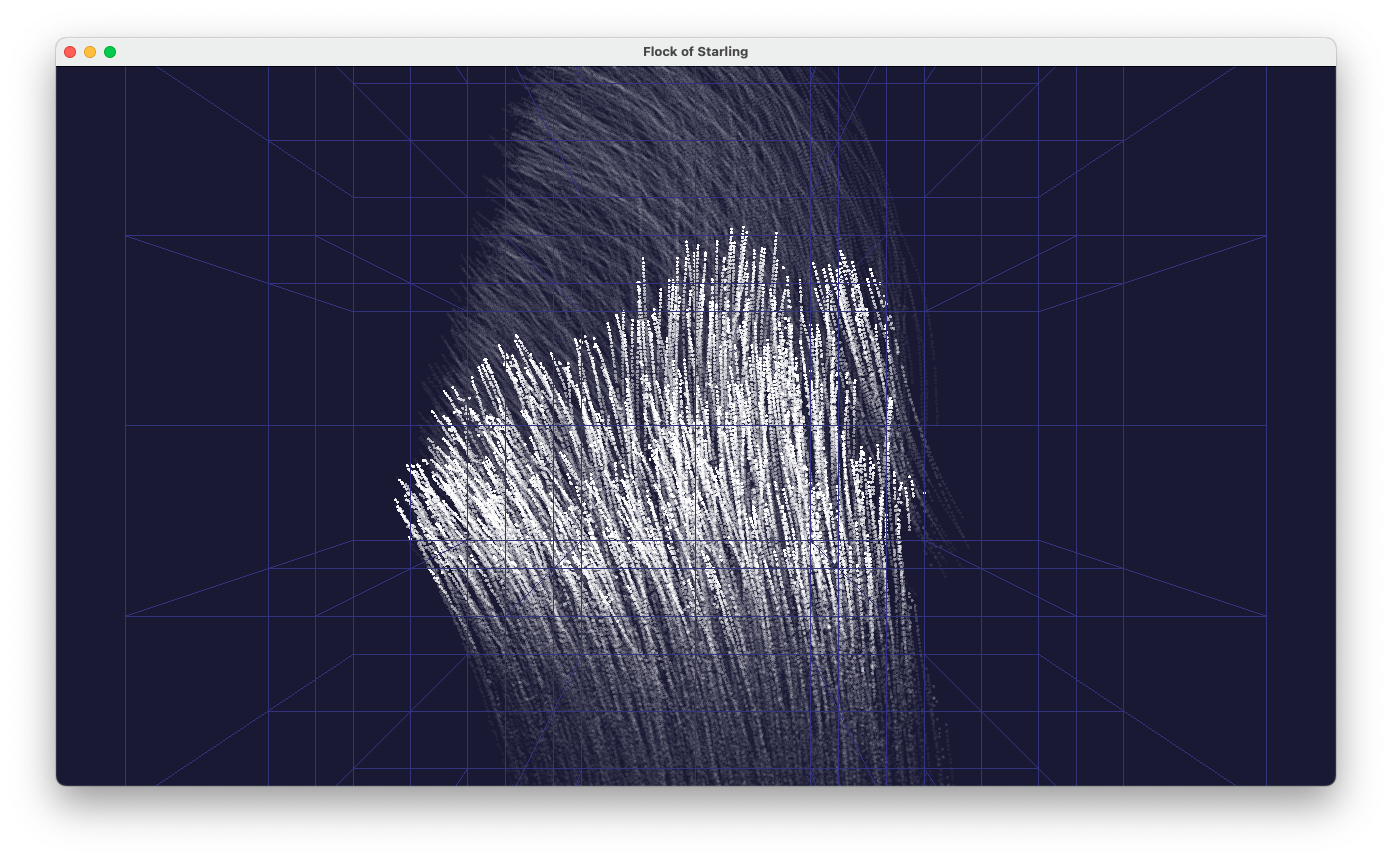
prog-12-2.pyの実行中の様子。 ムクドリの群れを上空から見下ろした様子。
プログラムの実行中、マウスドラッグで視点の回転、ホィールでズーミング、 カーソルキーで視点位置の前後左右の移動が可能。
 練習:1000万点のデータの表示
GitHubのこちらのURL
に、3次元座標をNumPyのnpy形式で1000万点格納したデータを用意した。
画面右上のダウンロードのアイコン(Download raw file)をクリックすると、10m-points.npyというファイルがダウンロードできるはずである。
これを
import numpy as np
data = np.load("10m-points.npy")
のように読み出すと shape=(10000000,3) の配列が得られる。この3つの列がx,y,z座標に対応している。
この節のサンプルプログラムを参考に、データを点群として表示し、「観察」してみなさい。